Yearly Statistics and Plots


|
High Temperature Low Temperature |
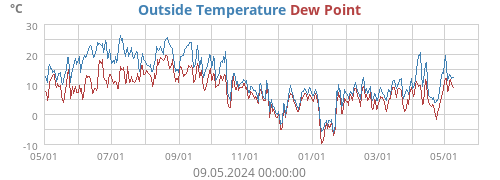
36,9°C at 25.07.2019 16:48:53 -8,1°C at 22.01.2019 06:58:18 |
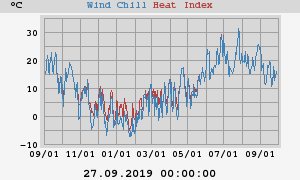
| High Heat Index | 36,9°C at 25.07.2019 16:48:53 |
| Low Wind Chill | -13,7°C at 22.01.2019 07:11:51 |
|
High Humidity Low Humidity |
100% 05.04.2019 06:51:34 21% 21.04.2019 16:34:12 |
|
High Dewpoint Low Dewpoint |
21,8°C 26.07.2019 20:31:25 -11,9°C 25.02.2019 04:51:25 |
|
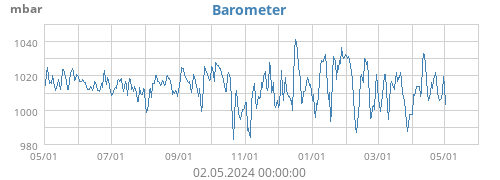
High Barometer Low Barometer |
1040,3 mbar at 23.02.2019 10:58:03 987,8 mbar at 27.01.2019 15:19:06 |
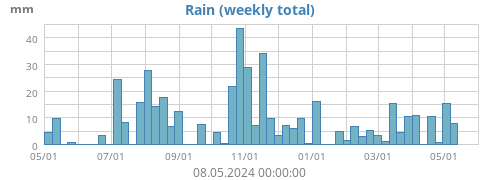
| Rain Total | 266,2 mm |
| High Rain Rate | 640,0 mm/hr at 10.03.2019 15:37:43 |
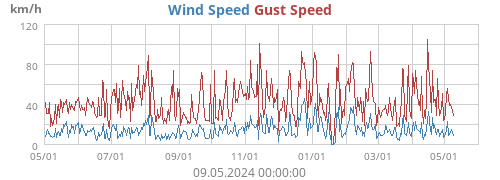
| High Wind Speed | 34,4 m/s from 281° at 10.03.2019 15:34:23 |
| Average Wind | 3,6 m/s |
| RMS Wind | 4,6 m/s |
|
Vector Average Speed Vector Average Direction |
1,3 m/s 284° |
|
High Inside Temperature Low Inside Temperature |
34,2°C at 30.06.2019 17:53:04 3,0°C at 22.01.2019 10:46:03 |
| Rain Year Total | 266,2 mm |
| High Rain Rate | 640,0 mm/hr at 10.03.2019 15:37:43 |